Santa Fe DataBase Solutions is a Sole Proprietorship located in Santa Fe, New Mexico.
SFDBS is exclusively engaged in promoting the use and commercialization of the
Method of Recursive Objects (US Pat 7,548,935).
Santa Fe DataBase Solutions
- FastTrack |
- Technology |
- Licensing |
- Contact |
- Site Map
Detailed Relative
Performance of A-L vs. PKFK vs. JT
Using the Wisconsin Database as a guide, a series of tests were performed comparing the relative performance of 3 foreign key relational database data structure representations:
- Primary Key / Foreign Key (PKFK)
- Junction Table (JT)
- Aggregate-Link
This page describes those tests.
Instead of the detail provided here, you may prefer to see the Performance Summary.
![]()
|
Introduction
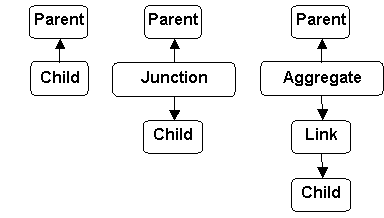
When we began serious effort on the Aggregate-Link (A-L) relationship representation, one immediate concern was performance: How would A-L perform compared to the two conventional representations, Primary Key / Foreign Key (PKFK) and Junction Table (JT). Figure 1 (above) shows the PKFK, JT and A-L schemas side-by-side. The corresponding SQL Select queries (to retrieve all attributes) are as follows:
/* Basic Query, PKFK representation */
select    *
from      Parent as P, Child as C
where     P.Parent_pk = C.Child_Parent_fk

/* Basic Query, JT representation */
select    *
from      Parent as P, Child as C, Junction as J
where     P.Parent_pk = J.Junction_Parent_fk
  and     J.Junction_Child_fk = C.Child_pk

/* Basic Query, A-L representation */
select    *
from      Parent as P, Child as C, Aggregate as A, Link as L
where     P.Parent_pk = A.Aggregate_Parent_fk
  and     A.Aggregate_pk = L.Link_Aggegate_fk
  and     L.Link_Child_fk = C.Child_pk
At the time, we only considered the use of A-L alongside PKFK&JT in conventional OLTP databases. Considering the number of join operators required for each representation, it was possible that A-L would be so slow compared to PKFK and JT that its use would be effectively prohibitive.
To address the issue, we designed a performance evaluation experiment following an approach used by Bitton, DeWitt and Turbyfill in their Wisconsin Benchmark.
The Wisconsin Database
The Wisconsin Database consists of two relations onek and tenk with identical schemas consisting of several integer and character attributes. The relations are populated with meaningless data, 1,000 tuples in onek, 10,000 tuples in tenk. Here is the CREATE TABLE declaration for tenk:
create table tenk (
	unique1     int   NOT NULL  unique,
	unique2     int   NOT NULL  unique,
	two         int,
	four        int,
	ten         int,
	twenty      int,
	hundred     int   NOT NULL,
	thousand    int,
	twothousand int,
	fivethous   int,
	tenthous    int,
	odd         int,
	even        int,
	stringu1    char(16),
	stringu2    char(16),
	string4     char(16))
There are no primary- or foreign keys per se. However, each relation has two candidate keys, unique1 and unique2 and in each relation, all the integer attributes have values equal to the value of unique1 for some tuple. (Similarly for unique2.) Attribute "two" has exactly 2 distinct values, attribute "four" has exactly 4 distinct values, etc. Each attribute value is uniformly distributed, so that for onek.two, each value is assigned 500 times and in tenk.two, each value is assigned 5,000 times. As a consequence, it is easy to design join queries over onek and tenk that will produce predictable numbers of response rows. This makes validating query responses easy. (There are many, many ways in which this database can be used for performance testing. We only describe the approach taken for the performance tests discussed here.)
Consider the following SQL join queries between onek and tenk:
select    *
from      onek as P, tenk as C
where     P.unique1 = C.hundred
The attribute values for tenk.hundred are in the range 0 to 99, 100 of each for a total of 10,000. Each of these values occurs exactly once in onek.unique1. The response to this query will therefore contain exactly 10,000 rows with 100 tenk tuples each joined to 100 onek tuples. (Equivalently, for each value 0,1,...,99, there will be 1 onek tuple joined to 100 tenk tuples.)
Comparing JT and A-L to PKFK requires equivalent representations. This required construction of duplicate onek and tenk relations with an added primary key for each, and the corresponding JT and A-L structure relations correctly valued so that the same onek and tenk tuples would be joined whether PKFK, JT or A-L was used. Copying PKFK relationships to JT or A-L is straightforward. (See Copying PKFK to A-L. Copying JT to A-L is similar.)
Platform
The platform consists of a popular, commercial RDBMS operating on a laptop running Windows XP(SP2). For legal reasons, we cannot identify the RDBMS. The use of a RDBMS server running on a laptop is inappropriate for production work, but is satisfactory for our needs because our only objective is a relative performance comparison. If A-L is inherently slower than PKFK by a factor of (say) 10, that would be very apparent from our tests.
Environment
The database was set up once for each of 5 test series. No other applications were allowed to run. Queries were submitted via an SQL front end. Between each test, the system was rebooted. This insured that cached pages from earlier runs would be unavailable from one test to the next, and therefore, would not reduce the running time. We captured both Elapsed Time (ET) and CPU Time using facilities of the SQL front end.
Procedure
We proceeded in two phases. The first "Range" phase is described in Performance Tests 1-3. The objective was to established a sample database of sufficient size to produce elapsed times of at least 30 seconds. This was deemed sufficient to show relative differences. (The entire suite includes more than 150 individual test queries!) ) The second "Performance" phase was to run a set of equivalent queries over different possible representations of the same data. The second phase had two parts: Part I (Performance Test 4) was for 1-to-M relationships and was run for equivalent PKFK, JT and A-L representations. Part II (Performance Test 5) was for M-to-M relationships, run only for JT and A-L. (PKFK cannot represent M-to-M relationships.)
Queries were each run twice, once with no limit on Buffer Cache Memory (bcm), once with a bcm limit of 4Mb. (4Mb was the minimum permitted by the RDBMS in Phase I, 5Mb in Phase II where the relations were larger.) More bcm means more cache space, and therefore fewer disk reads and less elapsed time.
Range Test 1
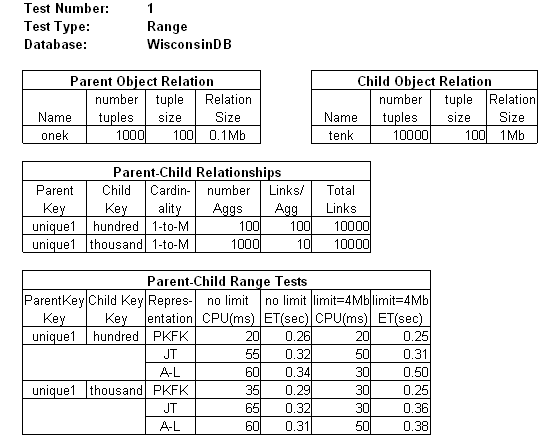
The first range test was run using the original Wisconsin database (WisconsinDB) with only the one modification: A primary key attribute was added for each relation. The Parent (object) relation was onek consisting of 1000 tuples of 100 bytes each for a total of 0.1Mb. The Child (object) relation was tenk consisting of 10,000 tuples of 100 bytes each. Only two queries were run:
select    *
from      onek as P, tenk as C
where     P.unique1 = C.hundred

select    *
from      onek as P, tenk as C
where     P.unique1 = C.thousand
The following tables summarize Range Test 1. Table "Parent Object Relation" indicates that the Parent relation was onek consisting of 1000 tuples of 100 bytes each for a total of 0.1Mb. Table "Child Object Relation" indicates that the Child relation was tenk consisting of 10,000 tuples of 100 bytes each for a total of 1 Mb.
The "Parent-Child Relationships" table indicates there are 2 join queries, the first with predicate "onek.unique1=tenk.hundred", the second with predicate "onek.unique1=tenk.thousand". The number of Aggregate tuples is respectively 100 and 1000. The number of Link tuples joined to each Aggregate tuple is respectively 100 and 10. In each case, there are 10,000 rows in the response.
|
Table "Parent-Child Range Tests" summarizes the results. Recall that the only purpose of this range test was to establish relations sufficiently large to produce response times (ET) of at least 30 seconds. For both joins and all 3 representations, the response time is less than half a second. Clearly the WisconsinDB database is too small.
Range Test 2
The SQL queries for Range Test 2 are identical to Range Test 1.
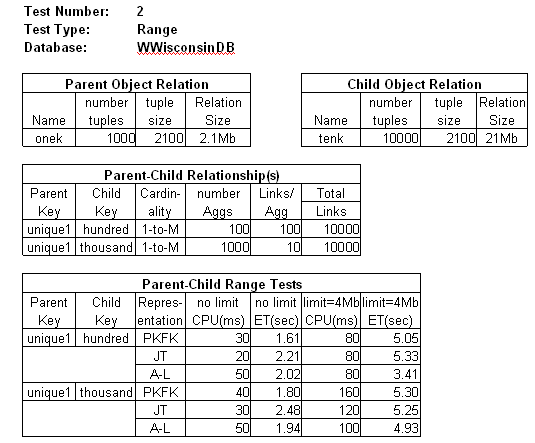
The "size" of a relation can be increased by increasing the tuple size or by increasing the number of tuples. For Range Test 2, we defined a new database WWisconsinDB (for "Wide WisconsinDB") in which the tuple size was increased to 2100 bytes for each relation. (This was done by adding 8 char attributes of 250 bytes each to the schema and valuing them. The size increase may be seen in the "Parent Object Relation" and "Child Object Relation" tables.)
|
Although increasing tuple size to 2100 bytes for onek and tenk helped, the response time is less than 6 seconds for each query and each representation. The number of tuples needs to be increased.
Range Test 3
The SQL queries for Range Test 3 over tenk and hundredk are equivalent to the SQL queries for Range Tests 1 and 2.
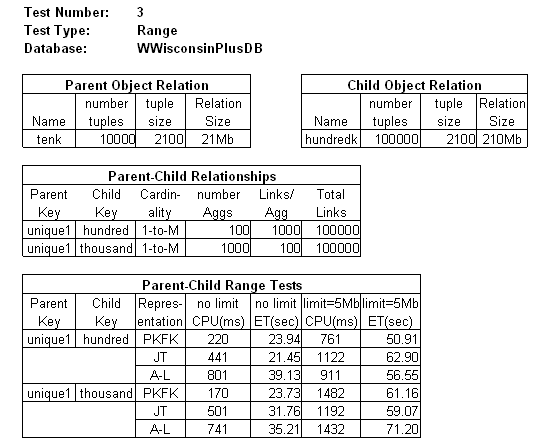
To increase tuple size and number of tuples, we shifted from joins over onek and tenk to joins over tenk and a new relation, hundredk with 100,000 tuples. (Relation onek has 1000 tuples and tenk has 10,000 tuples. Since their names reflect their sizes, we opted to create a new, 100,000 tuple relation, hundredk.) The attribute values in hundredk are distributed in the same manner as onek and tenk. As in Range Test 2, the tuple size for hundredk is 2100 bytes. The new database is called WWisconsinPlusDB.
The following tables summarize Range Test 3:
|
As table "Parent-Child Range Tests" shows, we now have response times in the desired range. The remaining tests are for performance.
Performance Test 4
Performance Test 4 measured response times for 4 join queries on all 3 representations. Here are the PKFK versions of the join queries:
select    *
from      tenk as P, hundredk as C
where     P.unique1 = C.two

select    *
from      tenk as P, hundredk as C
where     P.unique1 = C.twenty

select    *
from      tenk as P, hundredk as C
where     P.unique1 = C.hundred

select    *
from      tenk as P, hundredk as C
where     P.unique1 = C.thousand
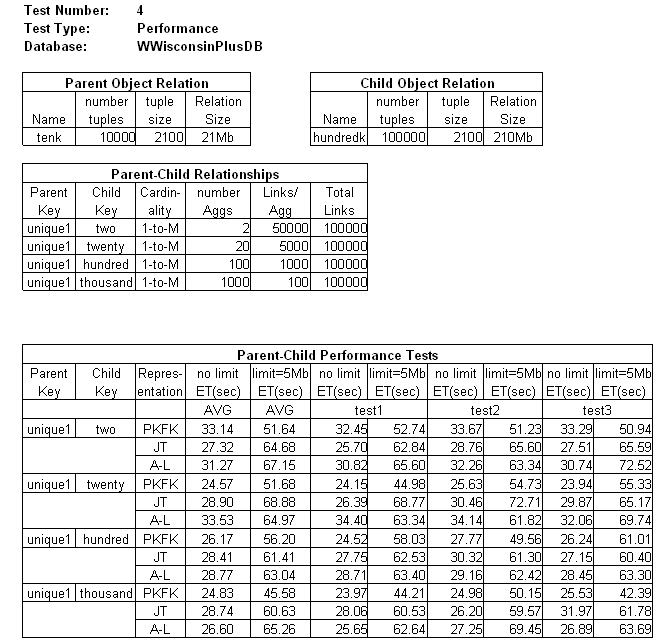
Notice that these queries represent different ratios of tenk tuples to hundredk tuples: 2:50,000 (that is, 2 parent objects with 50,000 childs each), 20:5,000, 100:1000 and 10,000:10. In each case, the response consists of 100,000 rows. Each query was run 5 times with bcm limited to 5Mb and 5 times with no declared limit. The best and worst observed values were discarded, leaving 3 tests per query per cache limit. The table shows individual test times and the average response times for both unlimited and limited bcm.
|
With no bcm limit and no other applications using memory, the RDBMS will use as much memory as it can obtain. Even so, relation hundredk is too large to fit in memory, so some repeat disk page access will always be required. Unlimited bcm produces average ETs (column 4) between 24 and 34 seconds for all queries and all representations. PKFK is always fastest, except for the tenk.unique1=hundredk.two join where it is slowest. (Not surprising given the number of times hundredk has to be scanned.) When bcm is limited to 5Mb, the PKFK average ET (column 5) shows a clearcut advantage over both JT and A-L. JT is (almost) always faster than A-L, but never by more than 10%.
Performance Test 5
Performance Test 5 is about M-to-M relationships. Here, only JT and A-L are tested because PKFK cannot represent M-to-M relationships. Attribute tenk.unique1 cannot be used because it is unique, but attribute tenk.thousand is not (unique). Attribute tenk.thousand has 1,000 different values, each occurring 10 times. The join queries for Performance Test 5 are:
select    *
from      tenk as P, hundredk as C
where     P.thousand = C.hundred

select    *
from      tenk as P, hundredk as C
where     P.thousand = C.thousand

select    *
from      tenk as P, hundredk as C
where     P.thousand = C.fivethous

select    *
from      tenk as P, hundredk as C
where     P.thousand = C.tenthous
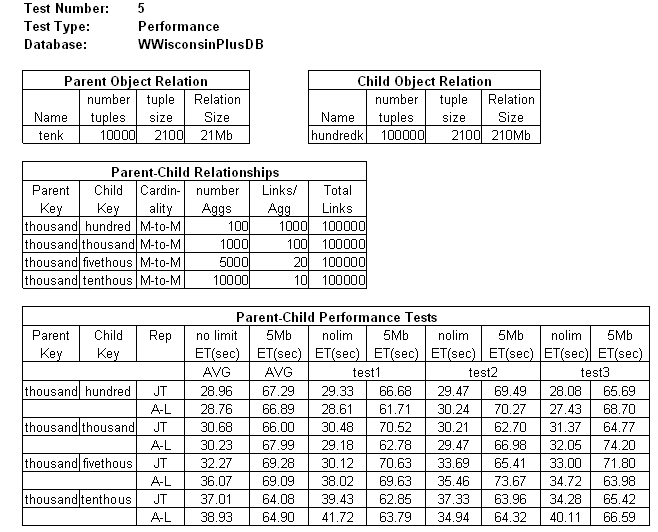
The ratios of tenk tuples to hundredk tuples for these queries are 100:1000, 1000:100, 5000:20 and 10,000:10. Each response contained 100,000 rows. The following tables summarize Performance Test 5:
|
Table "Parent-Child Performance Tests" shows that the performance of JT and A-L are close whether bcm is limited or not.
Summary
If we take the average of the averages for unlimited and limited bcm over all 1-to-M and all M-to-M tests (respectively Performance Test 4 and 5), we get the following:
| Cardinality | Representation | no bcm limit | 5Mb bcm limit |
|---|---|---|---|
| 1-to-M | PKFK | 27.18 | 51.28 |
| 1-to-M | JT | 28.34 | 63.90 |
| 1-to-M | A-L | 30.04 | 65.11 |
| M-to-M | JT | 32.23 | 66.66 |
| M-to-M | A-L | 33.50 | 67.22 |
For 1-to-M relationships, PKFK performed slightly faster than both JT and A-L when buffer cache memory (bcm) was not limited. With bcm limited to 5Mb, the differences were greater. Compared to PKFK, JT incurred a 4% penalty with no bcm limit and 25% with bcm limited to 5Mb. A-L incurred a 11% penalty with no bcm limit and 27% with bcm limited to 5Mb. For M-to-M relationships, the A-L structure incurred a 4% penalty compared to JT with no bcm limit and 1% with bcm limited to 5Mb.
These differences are not insignificant, but they suggest that the penalty for using A-L compared to PKFK is modest, and the penalty for using A-L compared to JT is virtually nil. More conclusive comparisons including update transactions awaits further performance testing.
Conclusions
This limited performance study was not intended to draw sweeping conclusion about the performance of the Aggregate-Link structure compared to more conventional methods. Updates weren't even addressed. But while the A-L method does appear to incur a performance penalty, the magnitude of that penalty is far less than might be expected based only on the number of joins. The very small tuple size in the Aggregate and Link structure relations implies a high ratio of tuples per disk page. As a consequence, the additional steps in the query execution plan for input of the A-L structure relations adds little disk access time to the overall totals compared to the disk access times for the Parent and Child object relations.
Developers of the test system's query optimizer could never have seen the Aggregate-Link representation before, so it isn't surprising that the optimizer doesn't appear to take tuple-size into account.
There are obvious and interesting optimization problems associated with the Aggregate-Link representation. We would appreciate hearing from anyone venturing into this area.
Page Content first published: November 13, 2007
Page Content last updated: December 27, 2007
